> ## Documentation Index
> Fetch the complete documentation index at: https://docs.restate.dev/llms.txt
> Use this file to discover all available pages before exploring further.
# Metrics
> Expose Restate Server Prometheus metrics.
Restate servers expose operational metrics in [Prometheus exposition format](https://github.com/prometheus/docs/blob/main/content/docs/instrumenting/exposition_formats.md) via the NodeCtl(port `5122`) endpoint, i.e. `localhost:5122/metrics`. For instance, configure Prometheus to scrape this endpoint every 30 seconds by adding this section to Prometheus configuration (assuming Restate server's IP address is `10.10.10.1` and accessible by Prometheus:
```yml theme={null}
scrape_configs:
- job_name: restate_server_1
metrics_path: "/metrics"
static_configs:
- targets:
- 10.10.10.1:5122
```
Note that some metrics are dependent on the value of `rocksdb-statistics-level` in the configuration file. In most cases, the default value will be sufficient for production deployment monitoring.
## Grafana Dashboards
Restate provides two pre-built Grafana dashboards for monitoring your cluster. You can import them directly from [Grafana.com](https://grafana.com/grafana/dashboards/):
| Dashboard | Grafana ID | Description |
| ---------------------- | ----------------------------------------------------- | ---------------------------------------------------- |
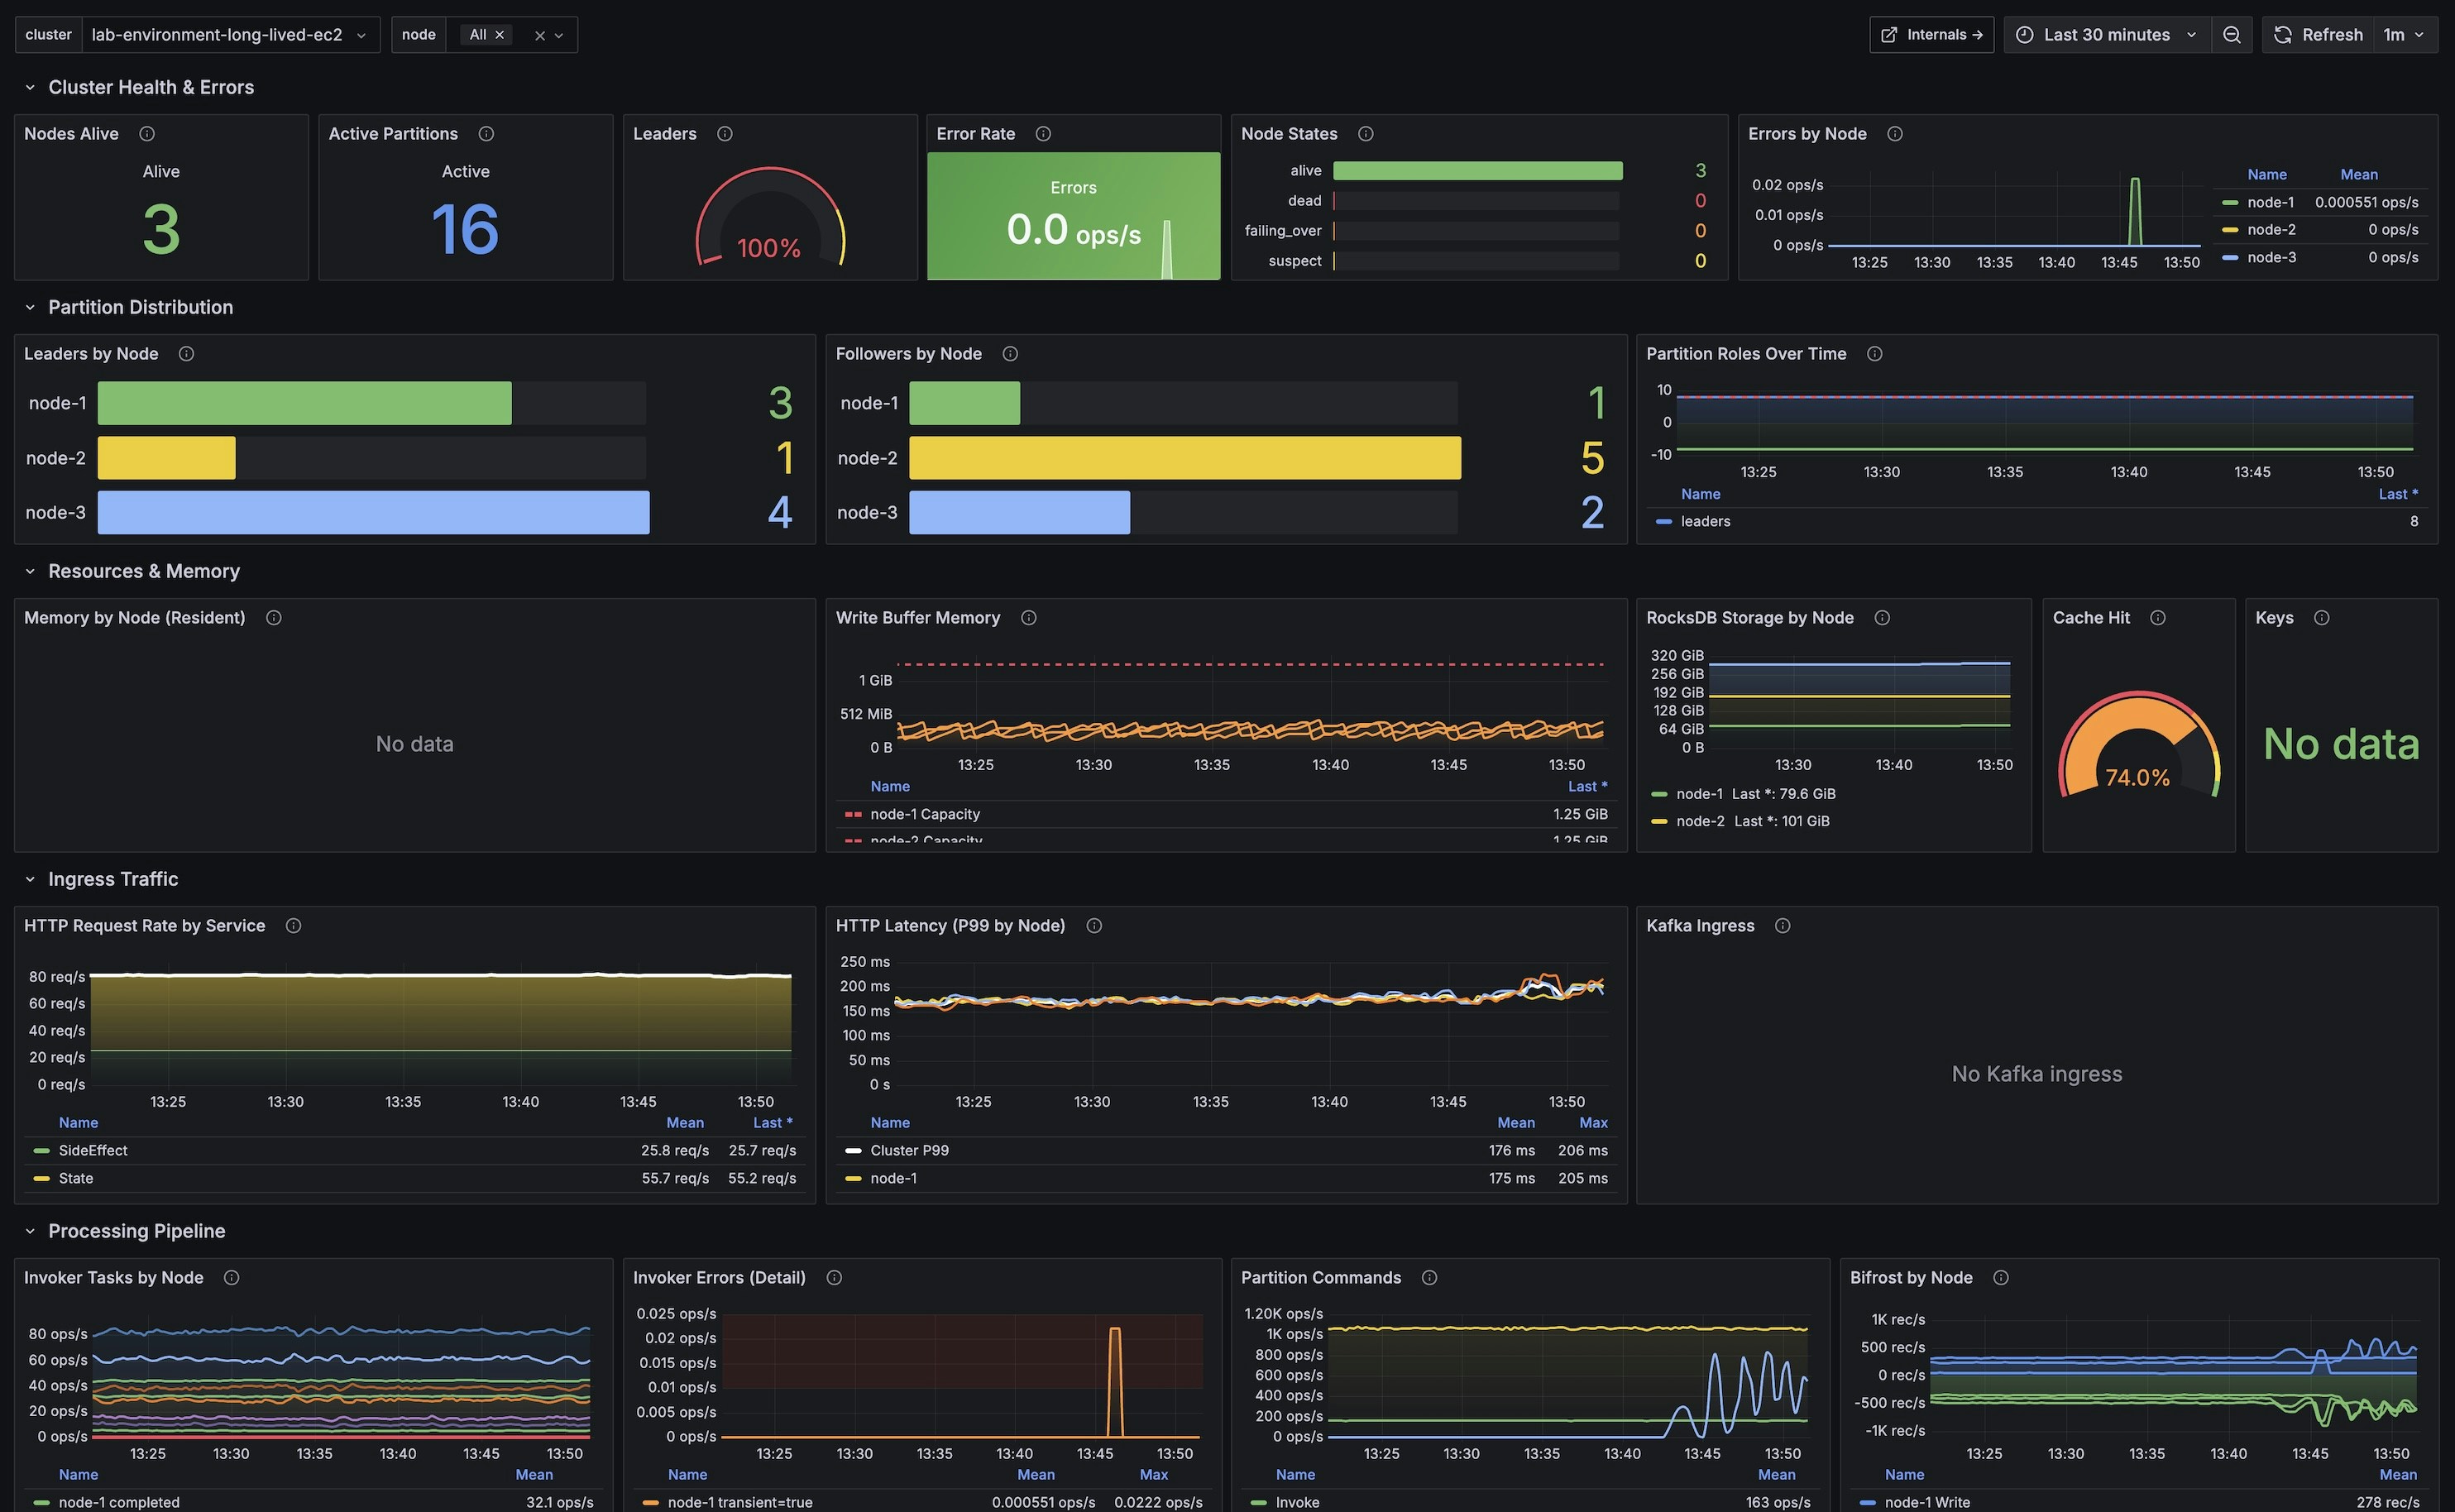
| **Restate: Overview** | [24747](https://grafana.com/grafana/dashboards/24747) | High-level cluster health, resources, and throughput |
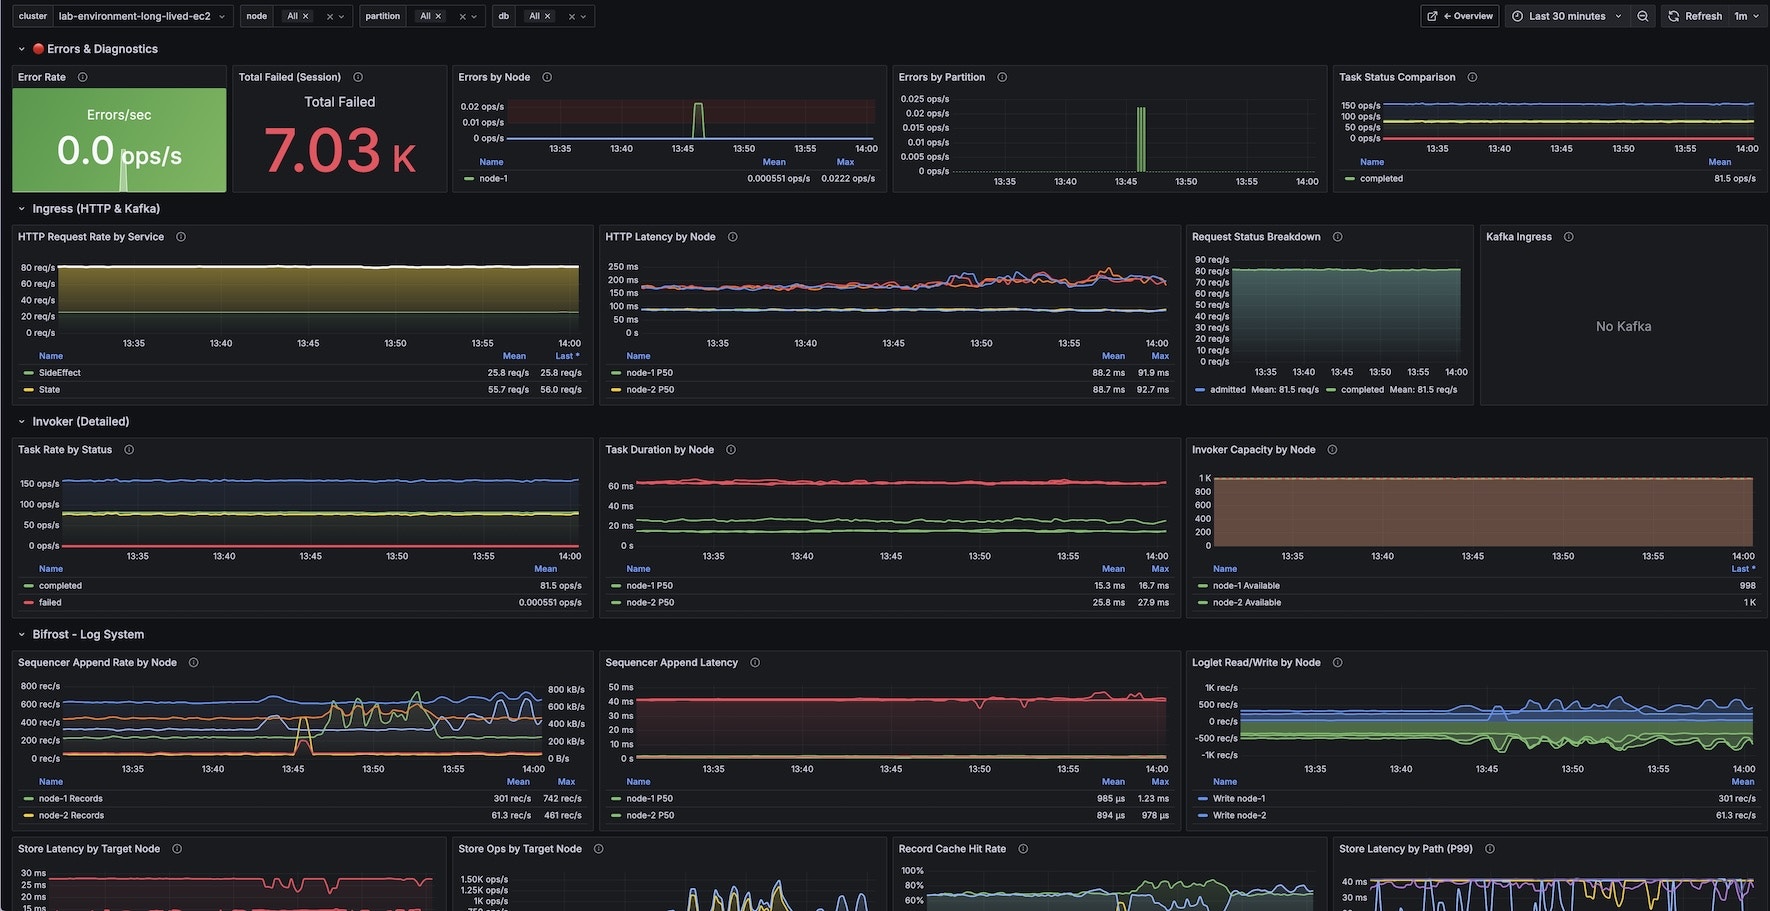
| **Restate: Internals** | [24748](https://grafana.com/grafana/dashboards/24748) | Deep-dive into Bifrost, Invoker, RocksDB, and more |
To import a dashboard:
1. Open Grafana and go to **Dashboards** > **Import**
2. Enter the dashboard ID (24747 or 24748) and click **Load**
3. Select your Prometheus datasource
4. Click **Import**
Import both dashboards to enable navigation links between them.
### Overview Dashboard
 ### Internals Dashboard
 ## Example Metrics
This is a non-exhaustive list of metrics that can be used to measure system performance:
* `restate_ingress_requests_total` (counter) - Number of ingress requests in different states (admitted, completed, throttled, etc.)
* `restate_ingress_request_duration_seconds` (summary) - Total latency of Ingress request processing in seconds
* `restate_rocksdb_estimate_live_data_size_bytes` (Gauge) - Size of the live data in RocksDb databases in bytes
* `restate_invoker_invocation_task_total` (counter) - The number of invocation tasks to user handlers
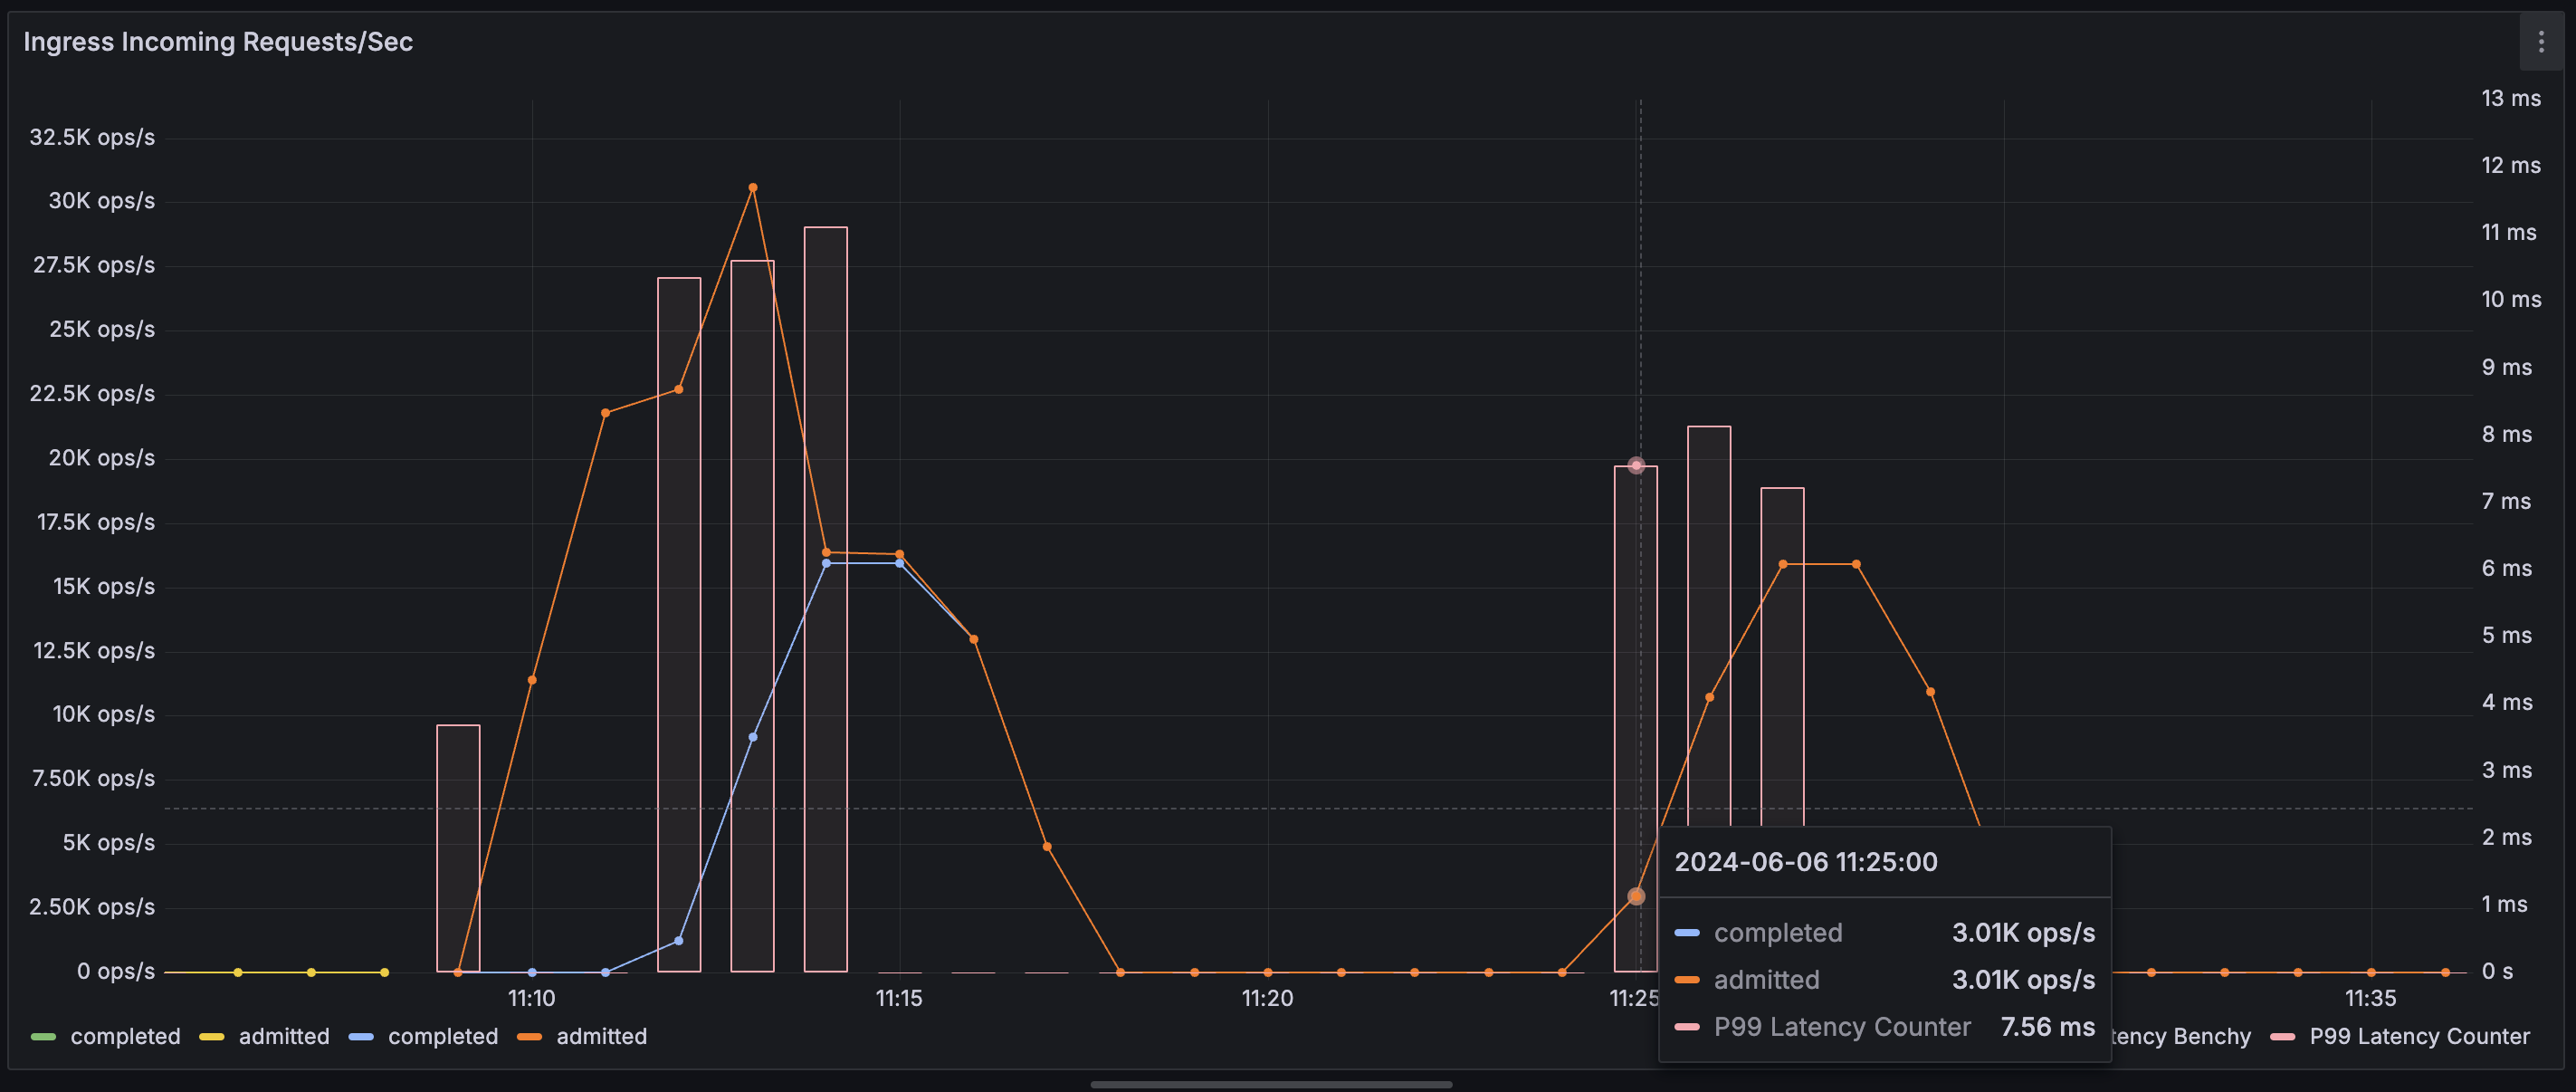
For example, we can use the following Prometheus queries to visualize throughput (ops/s) of HTTP ingress requests with an overlay of P99 latency:
```javascript theme={null}
rate(restate_ingress_requests_total{cluster_name="localcluster"}[$__rate_interval])
```
```javascript theme={null}
restate_ingress_request_duration_seconds{cluster_name="localcluster", quantile="0.99"}
```
## Example Metrics
This is a non-exhaustive list of metrics that can be used to measure system performance:
* `restate_ingress_requests_total` (counter) - Number of ingress requests in different states (admitted, completed, throttled, etc.)
* `restate_ingress_request_duration_seconds` (summary) - Total latency of Ingress request processing in seconds
* `restate_rocksdb_estimate_live_data_size_bytes` (Gauge) - Size of the live data in RocksDb databases in bytes
* `restate_invoker_invocation_task_total` (counter) - The number of invocation tasks to user handlers
For example, we can use the following Prometheus queries to visualize throughput (ops/s) of HTTP ingress requests with an overlay of P99 latency:
```javascript theme={null}
rate(restate_ingress_requests_total{cluster_name="localcluster"}[$__rate_interval])
```
```javascript theme={null}
restate_ingress_request_duration_seconds{cluster_name="localcluster", quantile="0.99"}
```