> ## Documentation Index
> Fetch the complete documentation index at: https://docs.restate.dev/llms.txt
> Use this file to discover all available pages before exploring further.
# Tracing
> Export OTEL traces of your invocations.
Restate supports the following tracing features:
* Runtime execution tracing per invocation, exported in real time while the invocation is running
* Exporting traces to OTLP-compatible systems (e.g. Jaeger)
* Correlating parent traces of incoming HTTP requests, using the [W3C TraceContext](https://github.com/w3c/trace-context) specification
* Propagating the trace context to your services, so spans created in your handlers join the same trace (see [End-to-end tracing with the SDKs](#end-to-end-tracing-with-the-sdks))
## Setting up OTLP exporter
Set up the [OTLP exporter](https://github.com/open-telemetry/opentelemetry-collector/blob/main/exporter/otlpexporter/README.md) by pointing the configuration entry `tracing-endpoint` to your trace collector.
By default, a `tracing-endpoint` using the `http://` or `https://` scheme will emit trace data in the OTLP/gRPC format.
Restate also supports the `otlp+http://` and `otlp+https://` schemes, to emit trace data in the OTLP/HTTP format.
Note that when using OTLP/HTTP, the `tracing-endpoint` URI usually needs to include an e.g. `/v1/traces` path.
### Exporting traces to Jaeger
[Jaeger](https://www.jaegertracing.io/docs/2.4/deployment/) accepts OTLP trace data on port `4317` (gRPC) and `4318` (HTTP).
Start Jaeger locally with Docker, for example:
```shell theme={null}
docker run -d --name jaeger \
-p 4317:4317 -p 4318:4318 -p 16686:16686 \
jaegertracing/jaeger:2.4.0
```
Configure the tracing endpoint in Restate as a valid URL:
```shell theme={null}
restate-server --tracing-endpoint http://localhost:4317 # for gRPC
restate-server --tracing-endpoint otlp+http://localhost:4318/v1/traces # for HTTP (note /v1/traces)
```
If you run Restate in Docker, then instead add the environment variable `-e RESTATE_TRACING_ENDPOINT=http://host.docker.internal:4317`.
If you now spin up your services and send requests to them, you will see the traces appear in the Jaeger UI at [http://localhost:16686](http://localhost:16686)
You can specify additional headers to be sent with the trace data by setting the `tracing-headers` configuration entry.
For example, to specify an `authorization` header add the following snippet to the [configuration file](/server/configuration/#configuration-file):
```toml theme={null}
[tracing-headers]
authorization = "Bearer some-auth-token"
```
You can configure a span/event filter in a similar fashion to the [log filter](/server/monitoring/logging#log-filter) setting the `tracing-filter` configuration entry.
If you can't configure a Jaeger agent, you can export traces by writing them to files, using the Jaeger JSON format.
To do so, set up the configuration entry `tracing-json-path` pointing towards the path where trace files should be written.
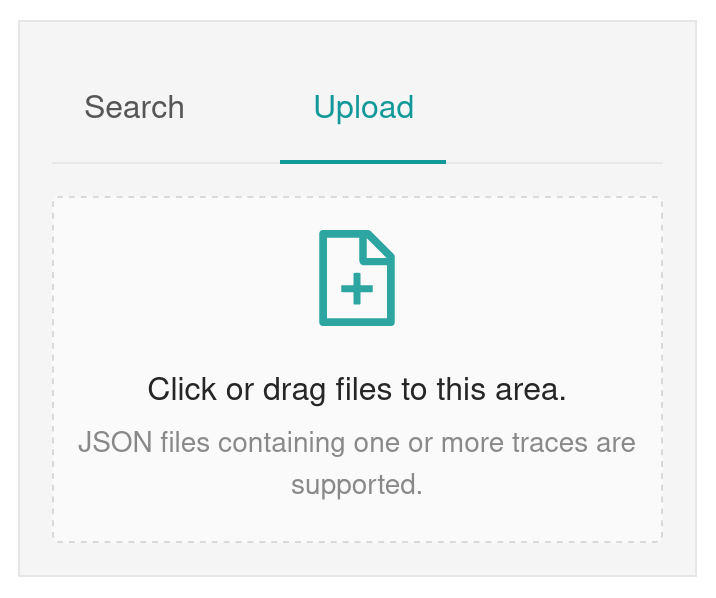
You can import the trace files using the Jaeger UI:
 ## Understanding traces
Restate traces represent what is physically happening during an invocation, while it is happening.
For every invocation, Restate emits the following spans:
| Span | Description |
| ----------------------------- | -------------------------------------------------------------------------------------------------------------------------------------------------------------------------------------- |
| `ingress ` | The HTTP request was received by the Restate ingress. Emitted only for invocations made over the ingress. |
| `invocation-start ` | The invocation started. This is the anchor span: all other spans of the invocation are children of it. |
| `invocation-attempt ` | One span per invocation attempt, emitted as soon as the attempt ends. Attempts that fail with a retryable error are marked with error status, so you can spot retry loops at a glance. |
| `invocation-end ` | The invocation completed, recording whether it succeeded or failed. |
Spans are exported **as soon as they end**, not when the whole invocation completes.
This means you can inspect invocations that are still running, for example to debug an invocation stuck in a retry loop.
## Understanding traces
Restate traces represent what is physically happening during an invocation, while it is happening.
For every invocation, Restate emits the following spans:
| Span | Description |
| ----------------------------- | -------------------------------------------------------------------------------------------------------------------------------------------------------------------------------------- |
| `ingress ` | The HTTP request was received by the Restate ingress. Emitted only for invocations made over the ingress. |
| `invocation-start ` | The invocation started. This is the anchor span: all other spans of the invocation are children of it. |
| `invocation-attempt ` | One span per invocation attempt, emitted as soon as the attempt ends. Attempts that fail with a retryable error are marked with error status, so you can spot retry loops at a glance. |
| `invocation-end ` | The invocation completed, recording whether it succeeded or failed. |
Spans are exported **as soon as they end**, not when the whole invocation completes.
This means you can inspect invocations that are still running, for example to debug an invocation stuck in a retry loop.
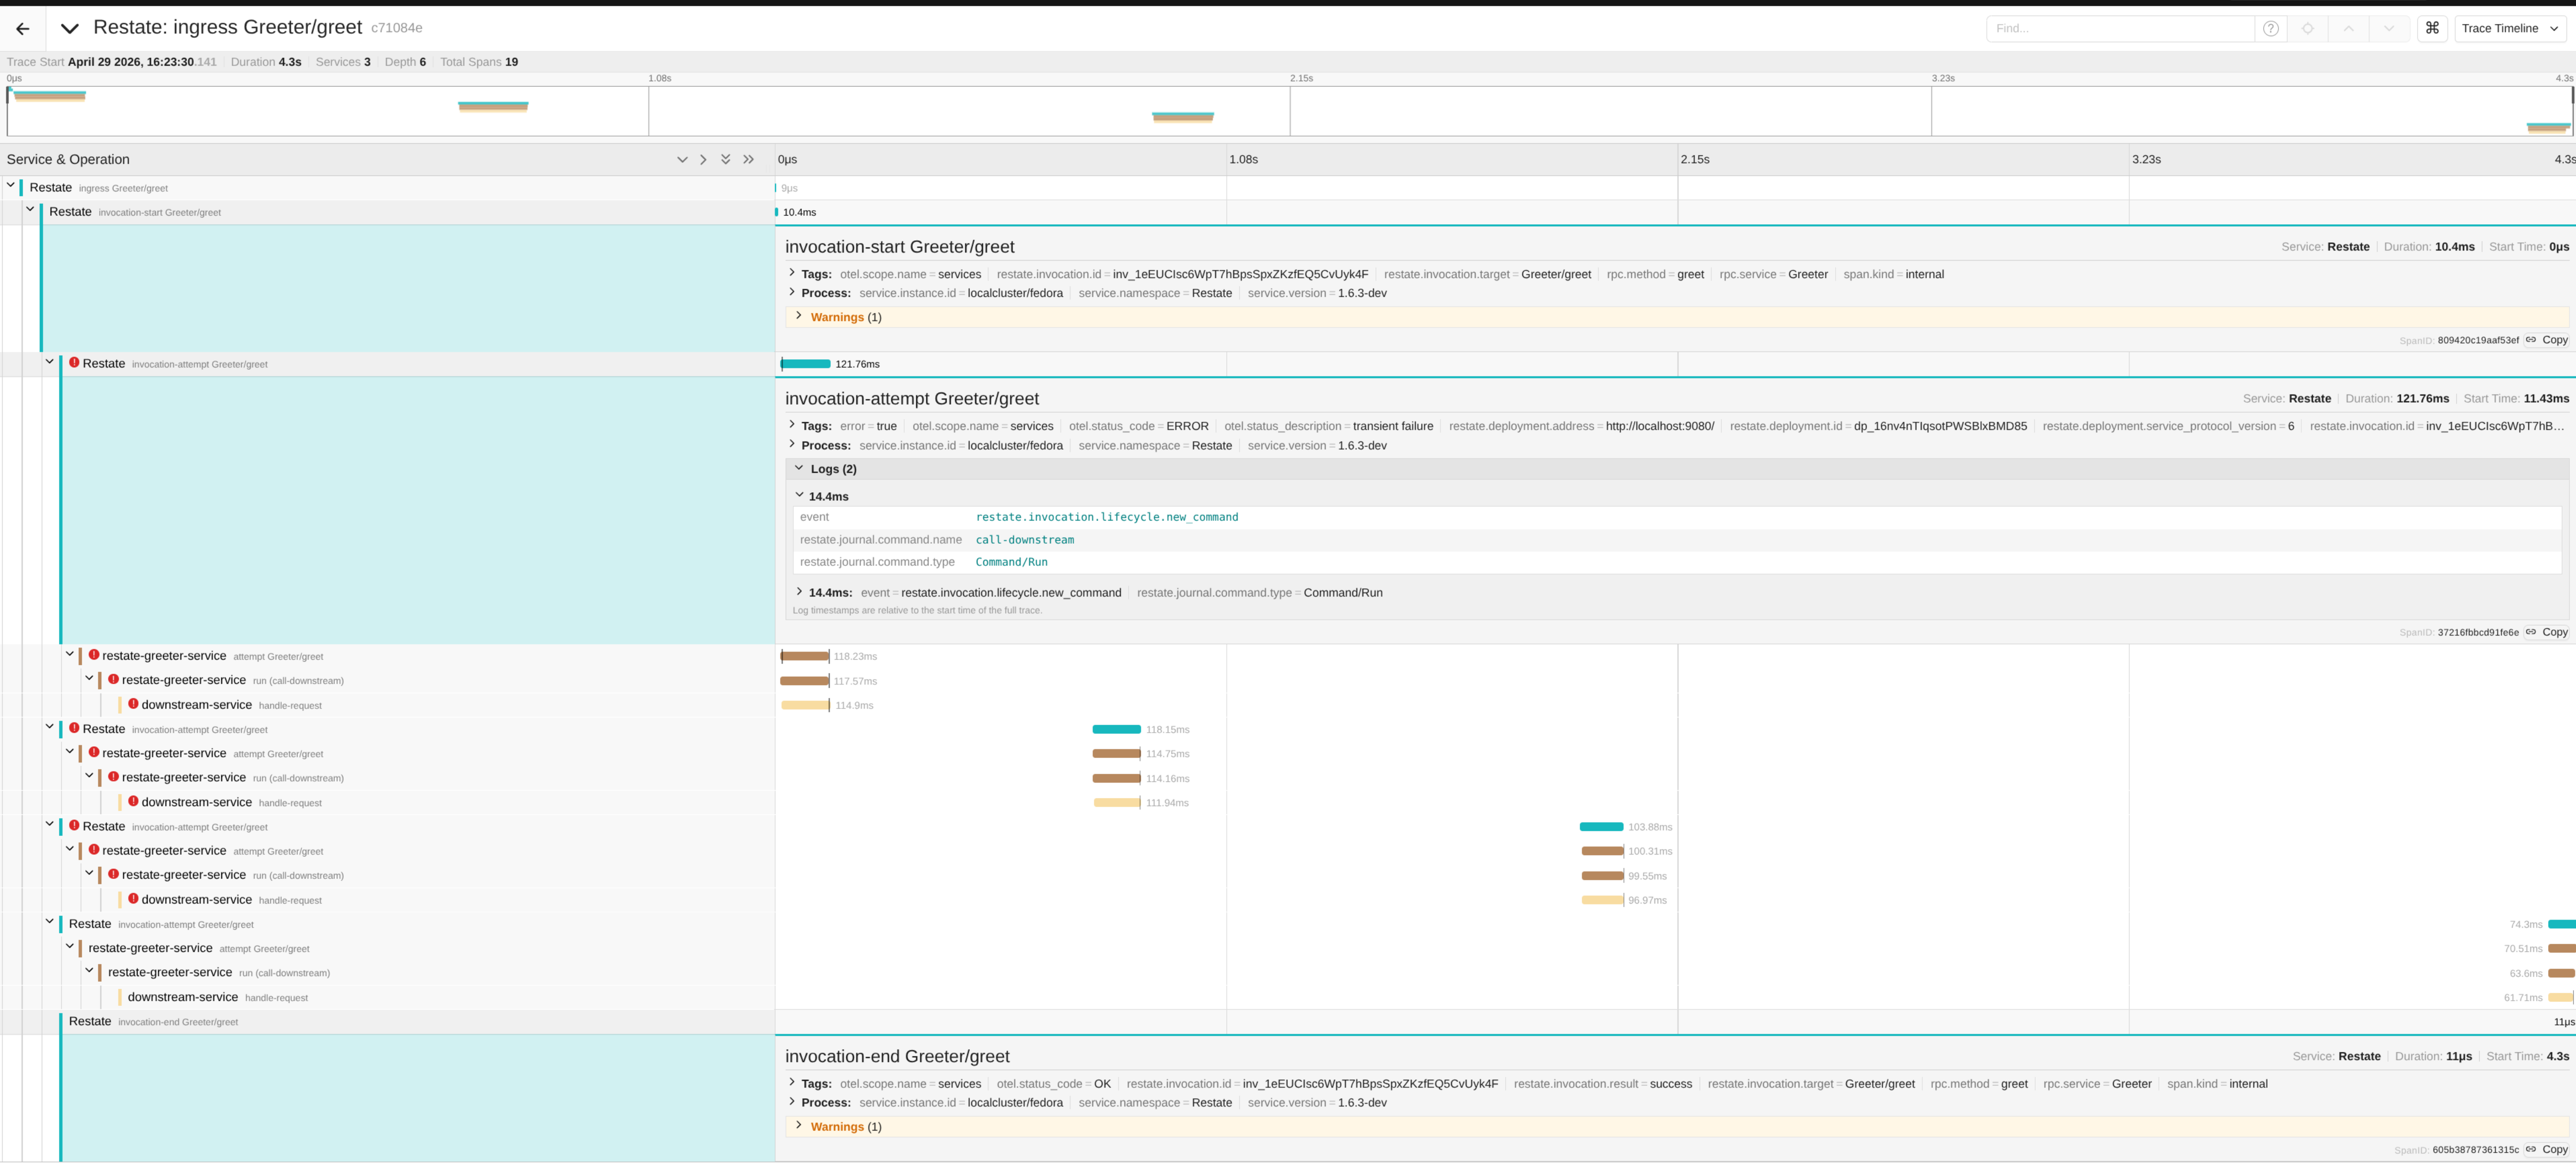 The example above shows an invocation that was retried a few times: each failed attempt is shown as a red `invocation-attempt` span, published right when the attempt failed.
The spans below each attempt are emitted by the service itself, using the [SDK tracing integrations](#end-to-end-tracing-with-the-sdks).
Operations performed by the handler (e.g. `ctx.run`, calls, sleeps, state access) are recorded as **events on the attempt span**, rather than as separate spans:
| Event | Description |
| ------------------------------------------ | ------------------------------------------------------------------------------------------------------------------------------------------------- |
| `restate.invocation.lifecycle.new_command` | The handler created a new journal command. The attributes `restate.journal.command.type` and `restate.journal.command.name` describe the command. |
| `restate.invocation.lifecycle.run_ended` | A `ctx.run` block finished executing. |
| `restate.invocation.lifecycle.suspended` | The invocation suspended, waiting for some condition (e.g. a timer, a call result). |
| `restate.invocation.lifecycle.yielded` | The invocation yielded the execution. |
When a handler calls another service, the child invocation joins the same trace.
One-way calls (send) are shown as separate traces instead, linked to the trace of the parent invocation.
To find them, search for the trace of the one-way call by filtering on the invocation id attribute `restate.invocation.id`.
Spans emitted by Restate are exported with the resource service name `Restate`, the process that physically produces them.
The logical, per-invocation view remains available in the Restate UI.
### Span attributes
Restate spans carry the following attributes, which you can use to build dashboards, alerts, and queries:
| Attribute | Spans | Description |
| --------------------------------------------- | -------------------- | ---------------------------------------------------------------------------------------------------- |
| `restate.invocation.id` | All | The invocation ID. |
| `restate.invocation.target` | All | The invocation target (e.g. `Greeter/greet` for services, `Greeter/myKey/greet` for keyed services). |
| `rpc.service` / `rpc.method` | All | The service name and the handler name. |
| `restate.deployment.id` | `invocation-attempt` | The ID of the deployment processing the attempt. |
| `restate.deployment.address` | `invocation-attempt` | The address of the deployment processing the attempt. |
| `restate.deployment.service_protocol_version` | `invocation-attempt` | The service protocol version used by the deployment. |
| `restate.invocation.result` | `invocation-end` | The invocation result: `success` or `failure`. |
| `restate.invocation.error.code` | `invocation-end` | The error code, if the invocation failed. |
| `error.message` | `invocation-end` | The error message, if the invocation failed. |
## End-to-end tracing with the SDKs
Restate propagates the [W3C TraceContext](https://github.com/w3c/trace-context) to your service on every invocation attempt.
The SDK tracing integrations use it to create a span per handler attempt, and a child span per `ctx.run` block, all joining the same trace:
* [TypeScript SDK tracing](/develop/ts/tracing)
* [Java/Kotlin SDK tracing](/develop/java/tracing)
The SDK spans carry the same `restate.invocation.id` and `restate.invocation.target` attributes as the runtime spans, so you can correlate them easily.
Spans created per `ctx.run` block carry the run name in the `restate.run.name` attribute.
Trace context propagation also works at the boundaries:
* **Upstream**: if the incoming HTTP request to the ingress carries a `traceparent` header, the invocation trace continues from it.
* **Downstream**: spans you create yourself inside your handlers (e.g. instrumented HTTP clients, database calls) attach to the trace of the current attempt.
## Searching traces
Traces export attributes that correlate the trace with the service and/or invocation. For example, in the Jaeger UI, you can filter on the invocation id (`restate.invocation.id`) or any other attribute:
The example above shows an invocation that was retried a few times: each failed attempt is shown as a red `invocation-attempt` span, published right when the attempt failed.
The spans below each attempt are emitted by the service itself, using the [SDK tracing integrations](#end-to-end-tracing-with-the-sdks).
Operations performed by the handler (e.g. `ctx.run`, calls, sleeps, state access) are recorded as **events on the attempt span**, rather than as separate spans:
| Event | Description |
| ------------------------------------------ | ------------------------------------------------------------------------------------------------------------------------------------------------- |
| `restate.invocation.lifecycle.new_command` | The handler created a new journal command. The attributes `restate.journal.command.type` and `restate.journal.command.name` describe the command. |
| `restate.invocation.lifecycle.run_ended` | A `ctx.run` block finished executing. |
| `restate.invocation.lifecycle.suspended` | The invocation suspended, waiting for some condition (e.g. a timer, a call result). |
| `restate.invocation.lifecycle.yielded` | The invocation yielded the execution. |
When a handler calls another service, the child invocation joins the same trace.
One-way calls (send) are shown as separate traces instead, linked to the trace of the parent invocation.
To find them, search for the trace of the one-way call by filtering on the invocation id attribute `restate.invocation.id`.
Spans emitted by Restate are exported with the resource service name `Restate`, the process that physically produces them.
The logical, per-invocation view remains available in the Restate UI.
### Span attributes
Restate spans carry the following attributes, which you can use to build dashboards, alerts, and queries:
| Attribute | Spans | Description |
| --------------------------------------------- | -------------------- | ---------------------------------------------------------------------------------------------------- |
| `restate.invocation.id` | All | The invocation ID. |
| `restate.invocation.target` | All | The invocation target (e.g. `Greeter/greet` for services, `Greeter/myKey/greet` for keyed services). |
| `rpc.service` / `rpc.method` | All | The service name and the handler name. |
| `restate.deployment.id` | `invocation-attempt` | The ID of the deployment processing the attempt. |
| `restate.deployment.address` | `invocation-attempt` | The address of the deployment processing the attempt. |
| `restate.deployment.service_protocol_version` | `invocation-attempt` | The service protocol version used by the deployment. |
| `restate.invocation.result` | `invocation-end` | The invocation result: `success` or `failure`. |
| `restate.invocation.error.code` | `invocation-end` | The error code, if the invocation failed. |
| `error.message` | `invocation-end` | The error message, if the invocation failed. |
## End-to-end tracing with the SDKs
Restate propagates the [W3C TraceContext](https://github.com/w3c/trace-context) to your service on every invocation attempt.
The SDK tracing integrations use it to create a span per handler attempt, and a child span per `ctx.run` block, all joining the same trace:
* [TypeScript SDK tracing](/develop/ts/tracing)
* [Java/Kotlin SDK tracing](/develop/java/tracing)
The SDK spans carry the same `restate.invocation.id` and `restate.invocation.target` attributes as the runtime spans, so you can correlate them easily.
Spans created per `ctx.run` block carry the run name in the `restate.run.name` attribute.
Trace context propagation also works at the boundaries:
* **Upstream**: if the incoming HTTP request to the ingress carries a `traceparent` header, the invocation trace continues from it.
* **Downstream**: spans you create yourself inside your handlers (e.g. instrumented HTTP clients, database calls) attach to the trace of the current attempt.
## Searching traces
Traces export attributes that correlate the trace with the service and/or invocation. For example, in the Jaeger UI, you can filter on the invocation id (`restate.invocation.id`) or any other attribute:
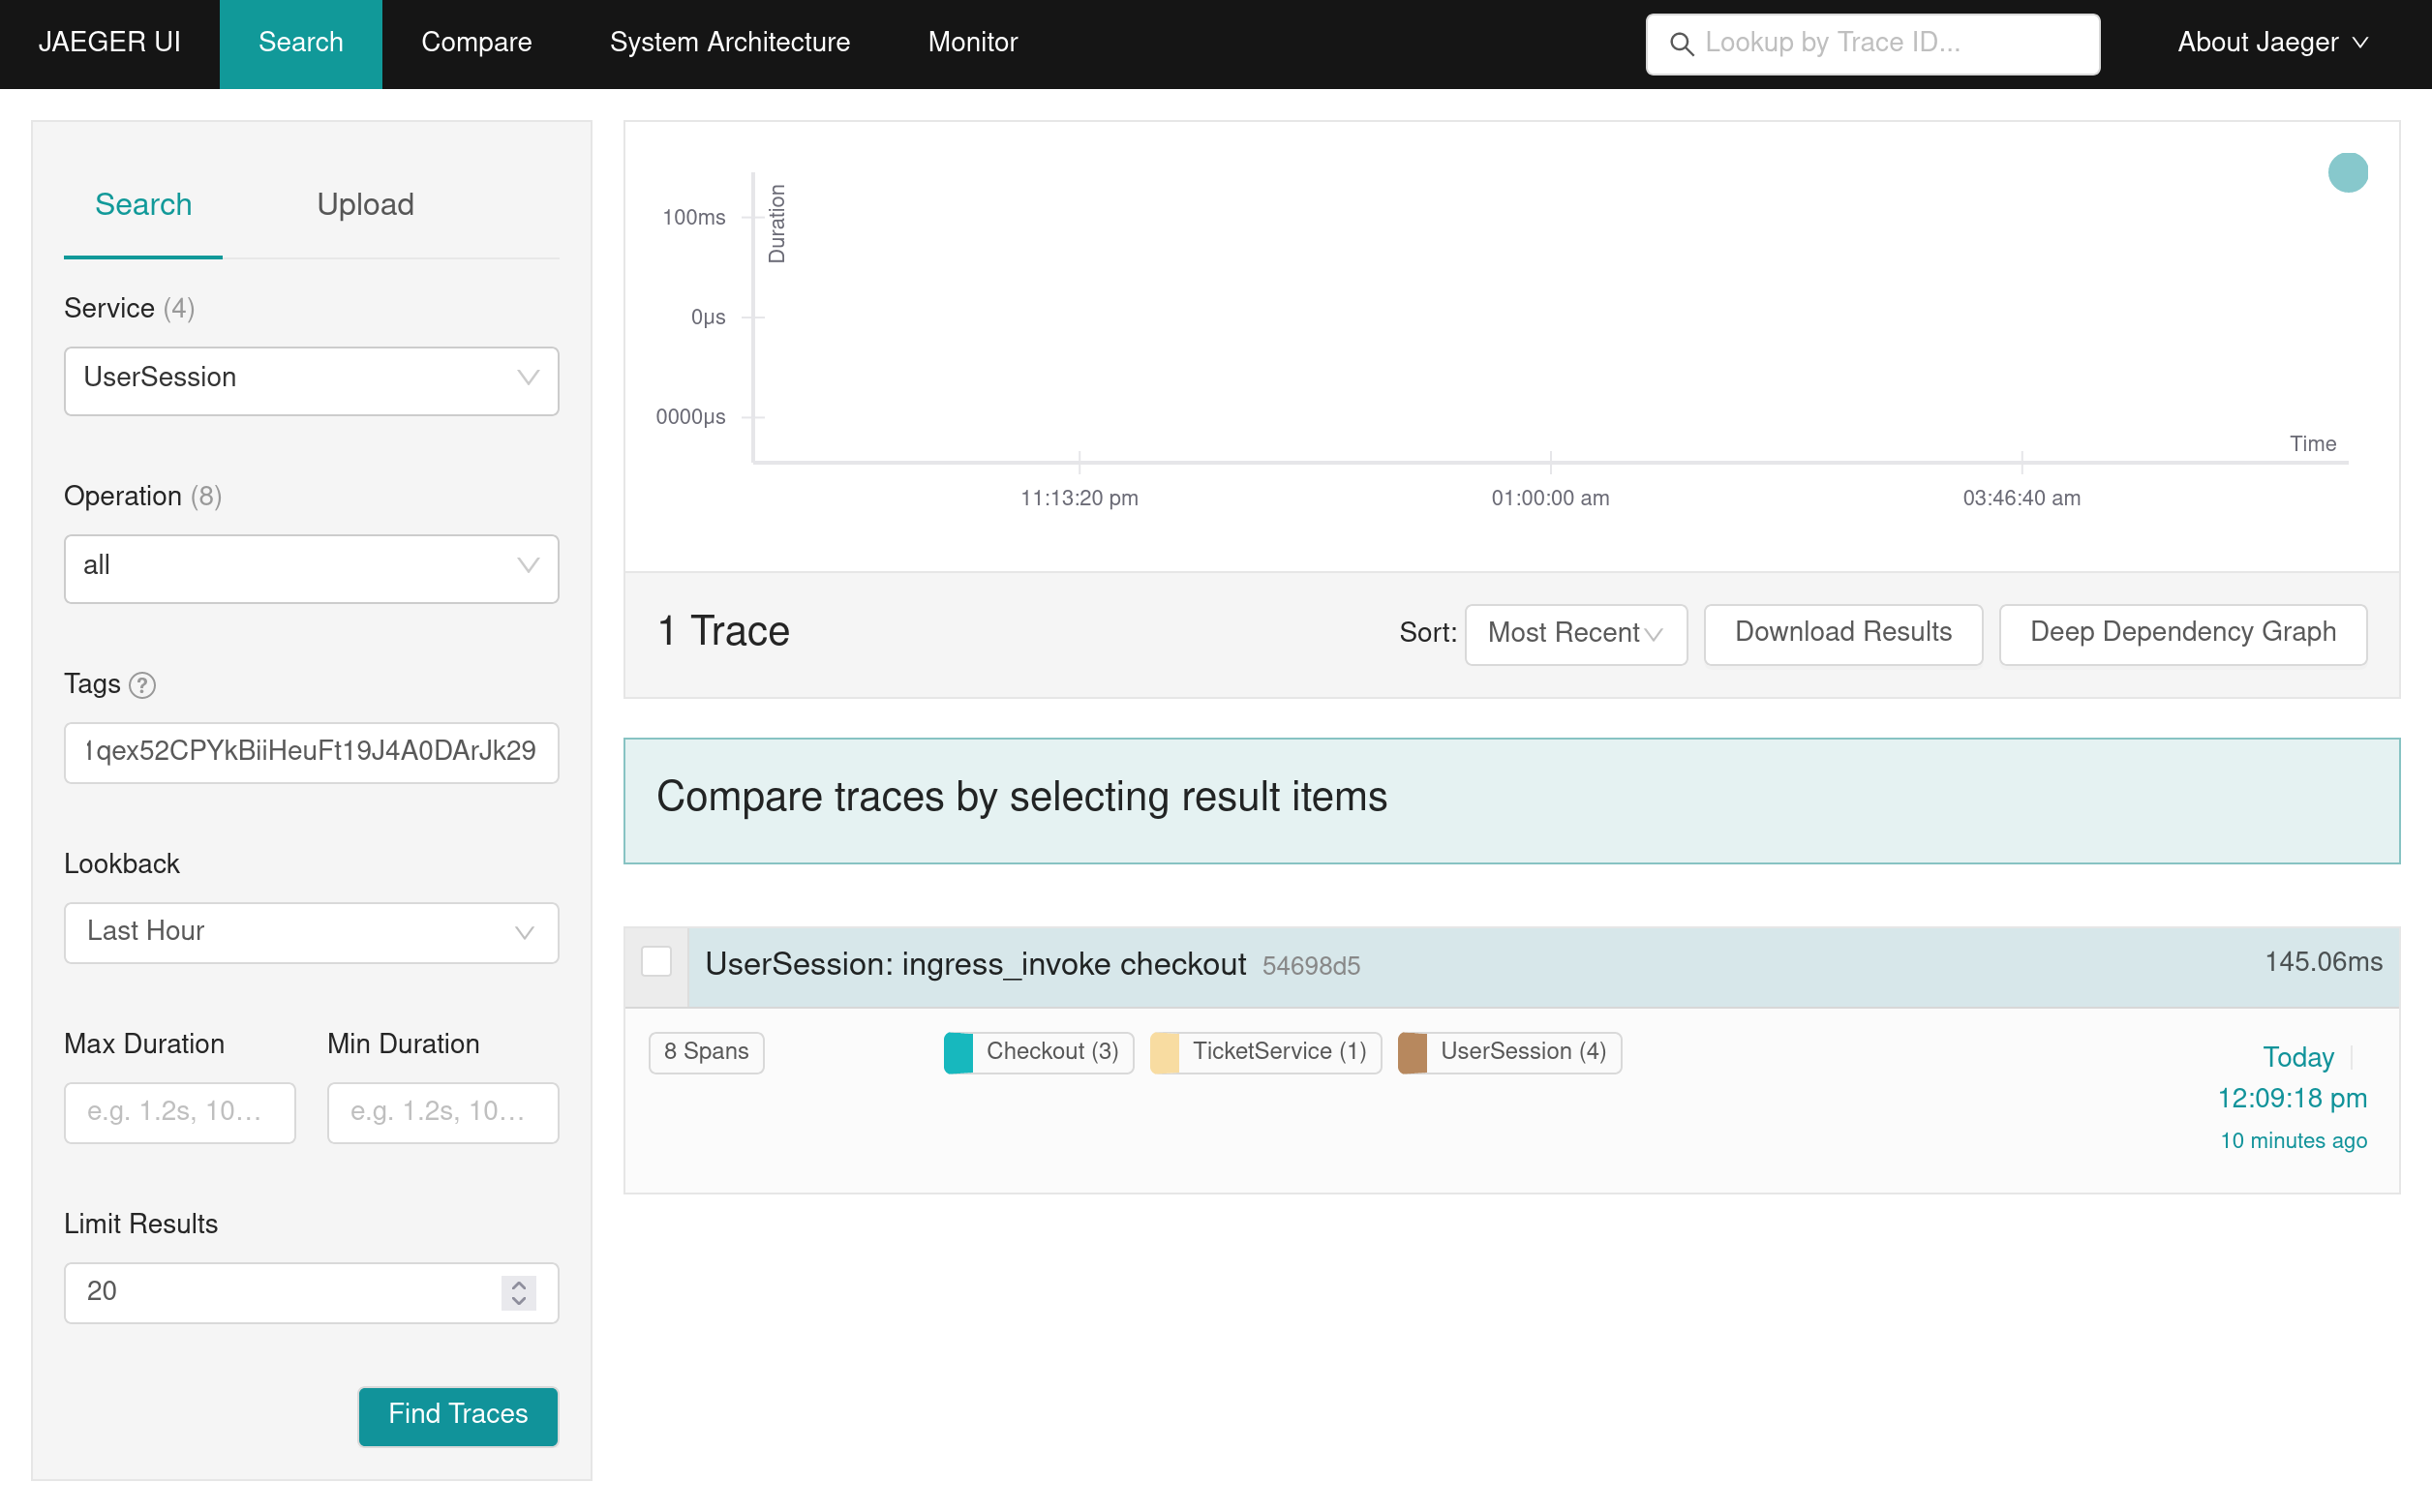 This also lets you navigate between the Restate UI and your tracing system: copy the invocation ID from the Restate UI and search for it in your tracing system, or vice versa.